
What University Students Learn In Visualization Classes
Maryam Hedayati and Matthew Kay
IEEE Trans. Visualization & Comp. Graphics (Proc. VIS) 2024
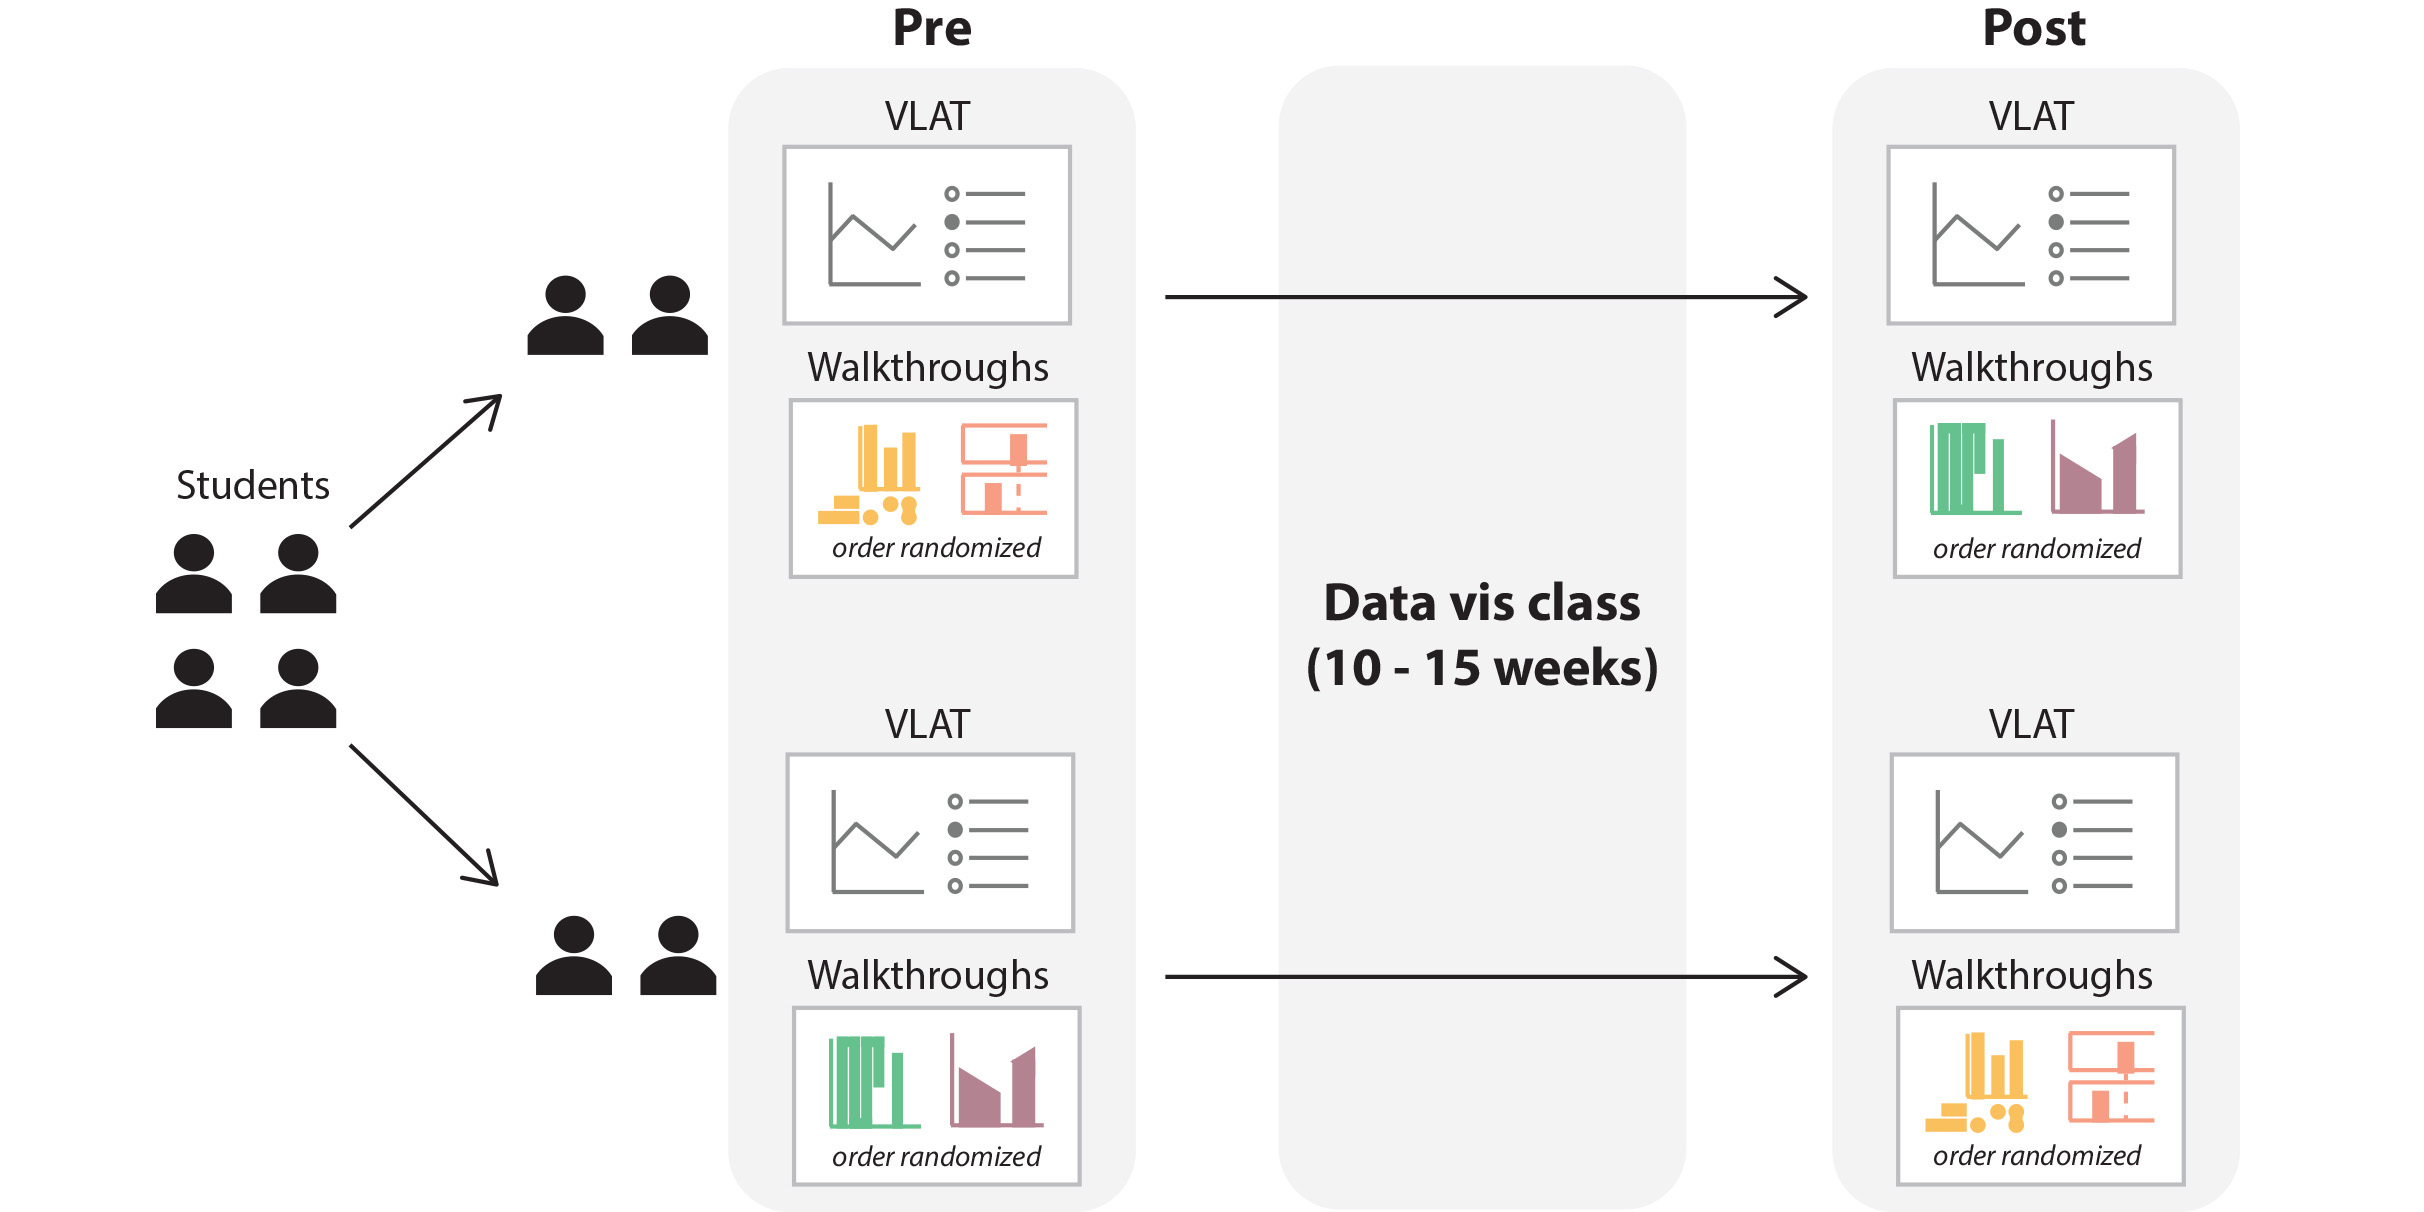
Overview of the study design. Participants were randomly assigned to one of two groups. During each study session, they completed the VLAT and a walkthrough of two unfamiliar visualizations. The visualizations they saw in each session were determined by the group they were assigned to.
Abstract
As a step towards improving visualization literacy, this work investigates how students approach reading visualizations differently after taking a university-level visualization course. We asked students to verbally walk through their process of making sense of unfamiliar visualizations, and conducted a qualitative analysis of these walkthroughs. Our qualitative analysis found that after taking a visualization course, students engaged with visualizations in more sophisticated ways: they were more likely to exhibit design empathy by thinking critically about the tradeoffs behind why a chart was designed in a particular way, and were better able to deconstruct a chart to make sense of it. We also gave students a quantitative assessment of visualization literacy and found no evidence of scores improving after the class, likely because the test we used focused on a different set of skills than those emphasized in visualization classes. While current measurement instruments for visualization literacy are useful, we propose developing standardized assessments for additional aspects of visualization literacy, such as deconstruction and design empathy. We also suggest that these additional aspects could be incorporated more explicitly in visualization courses. All supplemental materials are available at https://osf.io/w5pum/.