
Through a Live Elections Dashboard, Darkly: Managing Expectations and Trust in Progressive Vote Counting During the 2024 U.S. Election
Mandi Cai, Grace Wang, Chloe R. Mortenson, Fumeng Yang, Erik C. Nisbet, Matthew Kay
ACM Human Factors in Computing Systems (CHI) 2026
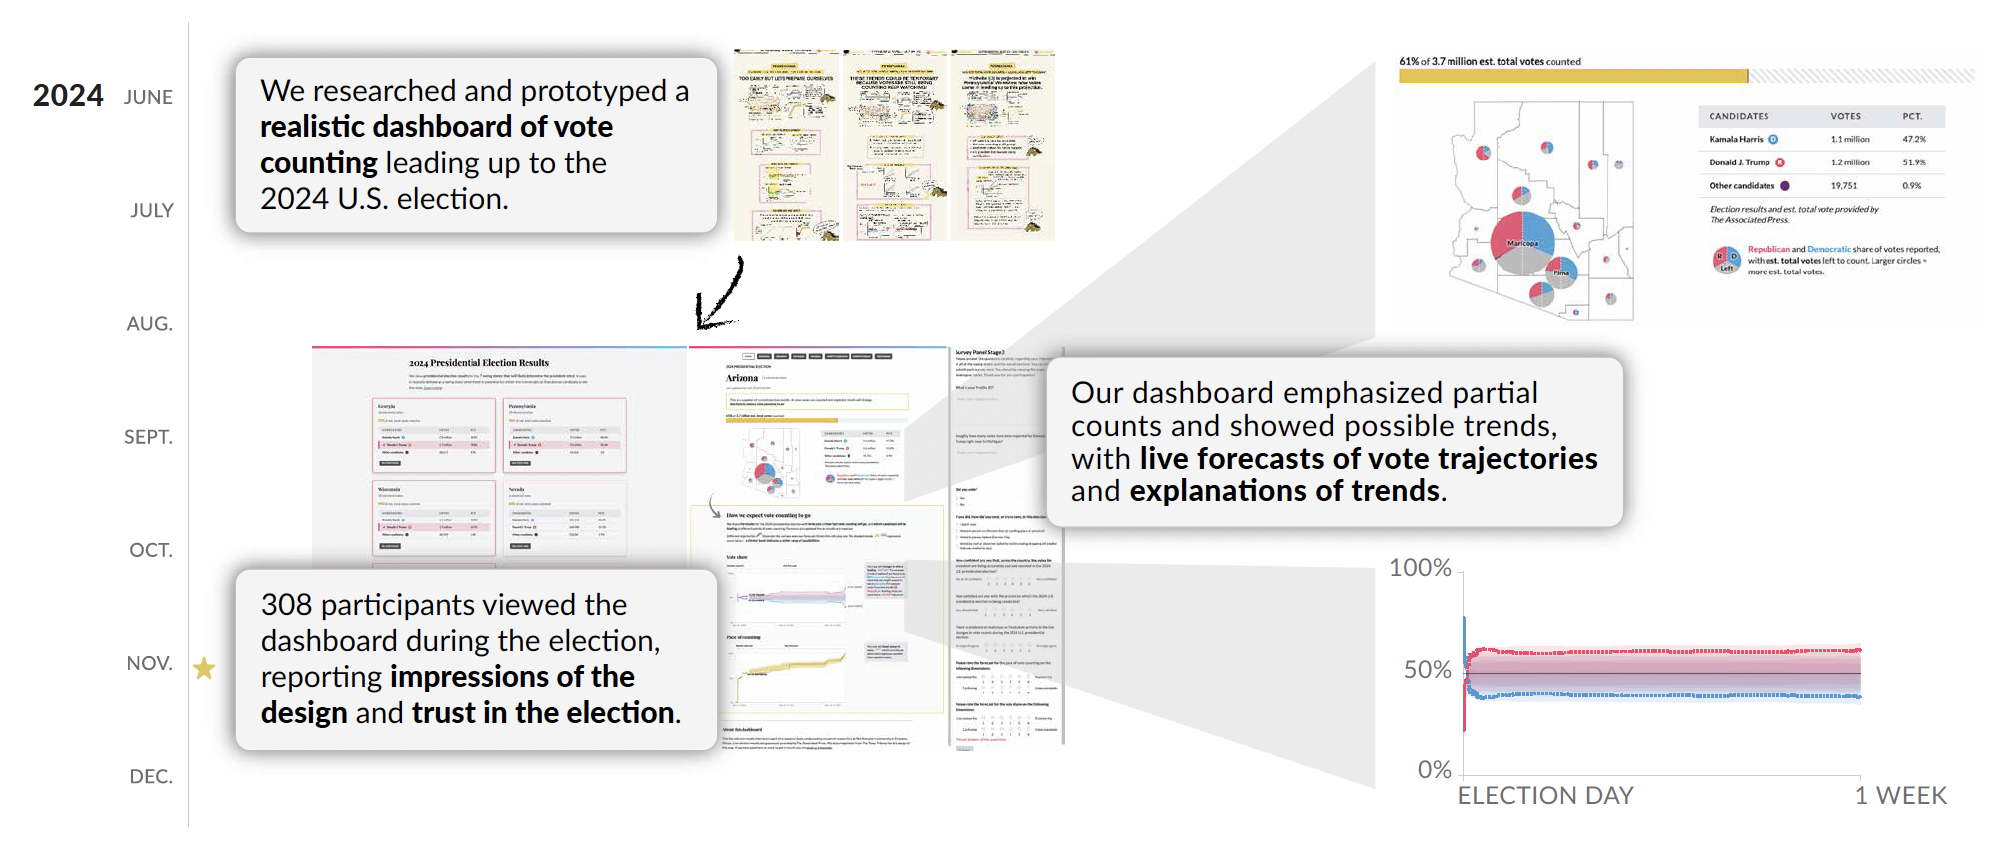
Summary of our design process and dashboard deployment.
Abstract
During U.S. elections, news outlets publish live dashboards to contextualize vote counting and manage public expectations. This proved challenging in 2020 amid election fraud allegations, sparking conversations about how data journalists might better visualize and explain live vote counting. To address this, we designed a dashboard to foster understanding of the progressive nature of vote counts and more realistic expectations of the vote counting timeline. We deployed it during the 2024 U.S. presidential election, showing it to 308 people with real results, and collected surveys and interviews on impressions and trust. We contribute: (1) a design process and framework for how audiences might form expectations around live data, (2) survey findings suggesting live forecasts slightly increased confidence in vote counting and slightly reduced belief in evidence of fraud, and (3) interview findings underscoring the importance of agency in viewing live data and tensions in the perceived usefulness of live forecasts. Our supplementary materials are available at https://osf.io/qxk2t/.