
Exploring the Effects of Aggregation Choices on Untrained Visualization Users’ Generalizations from Data
Francis Nguyen, Xiaoli Qiao, Jeffrey Heer, Jessica Hullman
Computer Graphics Forum 2020
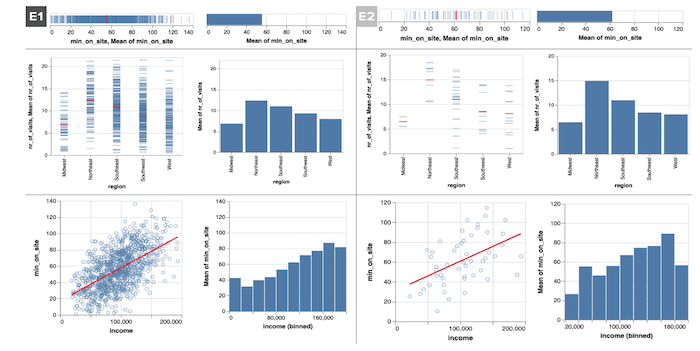
Examples of stimuli used in Experiment 1 and Experiment 2. Shown are disaggregated data with mean (left) and mean aggregated data (right) for Experiment 1 (n=1000, left column) and Experiment 2 (n=50, right column). Disaggregated data stimuli simply have the mean mark in red removed for each chart. Each row depicts the data-type combination: univariate (top), one quantitative and one categorical attribute (middle), and two quantitative attributes (bottom).
Abstract
Visualization system designers must decide whether and how to aggregate data by default. Aggregating distributional information in a single summary mark like a mean or sum simplifies interpretation, but may lead untrained users to overlook distributional features. We ask, How are the conclusions drawn by untrained visualization users affected by aggregation strategy? We present two controlled experiments comparing generalizations of a population that untrained users made from visualizations that summarized either a 1000 record or 50 record sample with either single mean summary mark, a disaggregated view with one mark per observation, or a view overlaying a mean summary mark atop a disaggregated view. While we observe no reliable effect of aggregation strategy on generalization accuracy at either sample size, users of purely disaggregated views were slightly less confident in their generalizations on average than users whose views show a single mean summary mark, and less likely to engage in dichotomous thinking about effects as either present or absent. Comparing results from 1000 record to 50 record dataset, we see a considerably larger decrease in the number of generalizations produced and reported confidence in generalizations among viewers who saw disaggregated data relative to those who saw only mean summary marks.