
Revealing Perceptual Proxies with Adversarial Examples
Brian D. Ondov, Fumeng Yang, Matthew Kay; Niklas Elmqvist, Steven Franconeri
IEEE Trans. Visualization & Comp. Graphics (Proc. INFOVIS) 2020
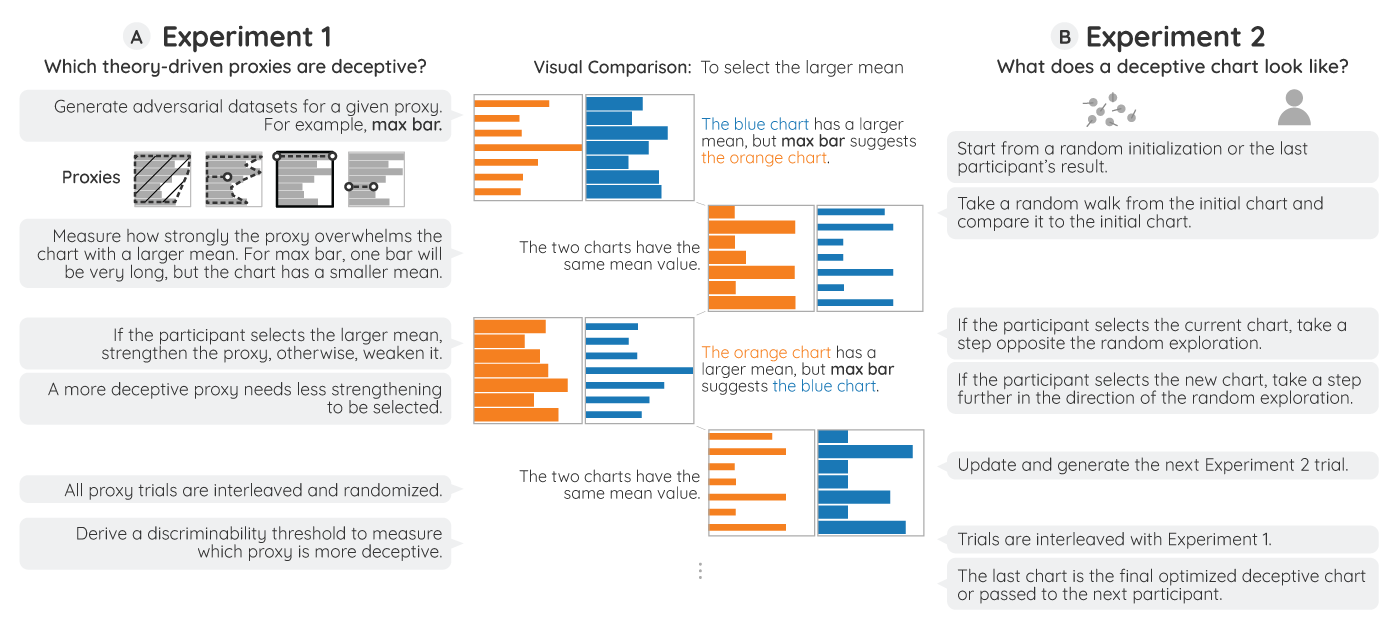
A “theory-driven” approach (A) and a “data-driven” approach (B) for uncovering how the visual system extracts statistics from a visualization, by pitting correct answers against adversarial models of candidate perceptual proxies
Abstract
Data visualizations convert numbers into visual marks so that our visual system can extract data from an image instead of raw numbers. Clearly, the visual system does not compute these values as a computer would, as an arithmetic mean or a correlation. Instead, it extracts these patterns using perceptual proxies; heuristic shortcuts of the visual marks, such as a center of mass or a shape envelope. Understanding which proxies people use would lead to more effective visualizations. We present the results of a series of crowdsourced experiments that measure how powerfully a set of candidate proxies can explain human performance when comparing the mean and range of pairs of data series presented as bar charts. We generated datasets where the correct answer-the series with the larger arithmetic mean or range-was pitted against an “adversarial” series that should be seen as larger if the viewer uses a particular candidate proxy. We used both Bayesian logistic regression models and a robust Bayesian mixed-effects linear model to measure how strongly each adversarial proxy could drive viewers to answer incorrectly and whether different individuals may use different proxies. Finally, we attempt to construct adversarial datasets from scratch, using an iterative crowdsourcing procedure to perform black-box optimization.