
A Probabilistic Grammar of Graphics
Xiaoying Pu and Matthew Kay
ACM Human Factors in Computing Systems (CHI) 2020 | ![]() BEST PAPER HONORABLE MENTION
BEST PAPER HONORABLE MENTION
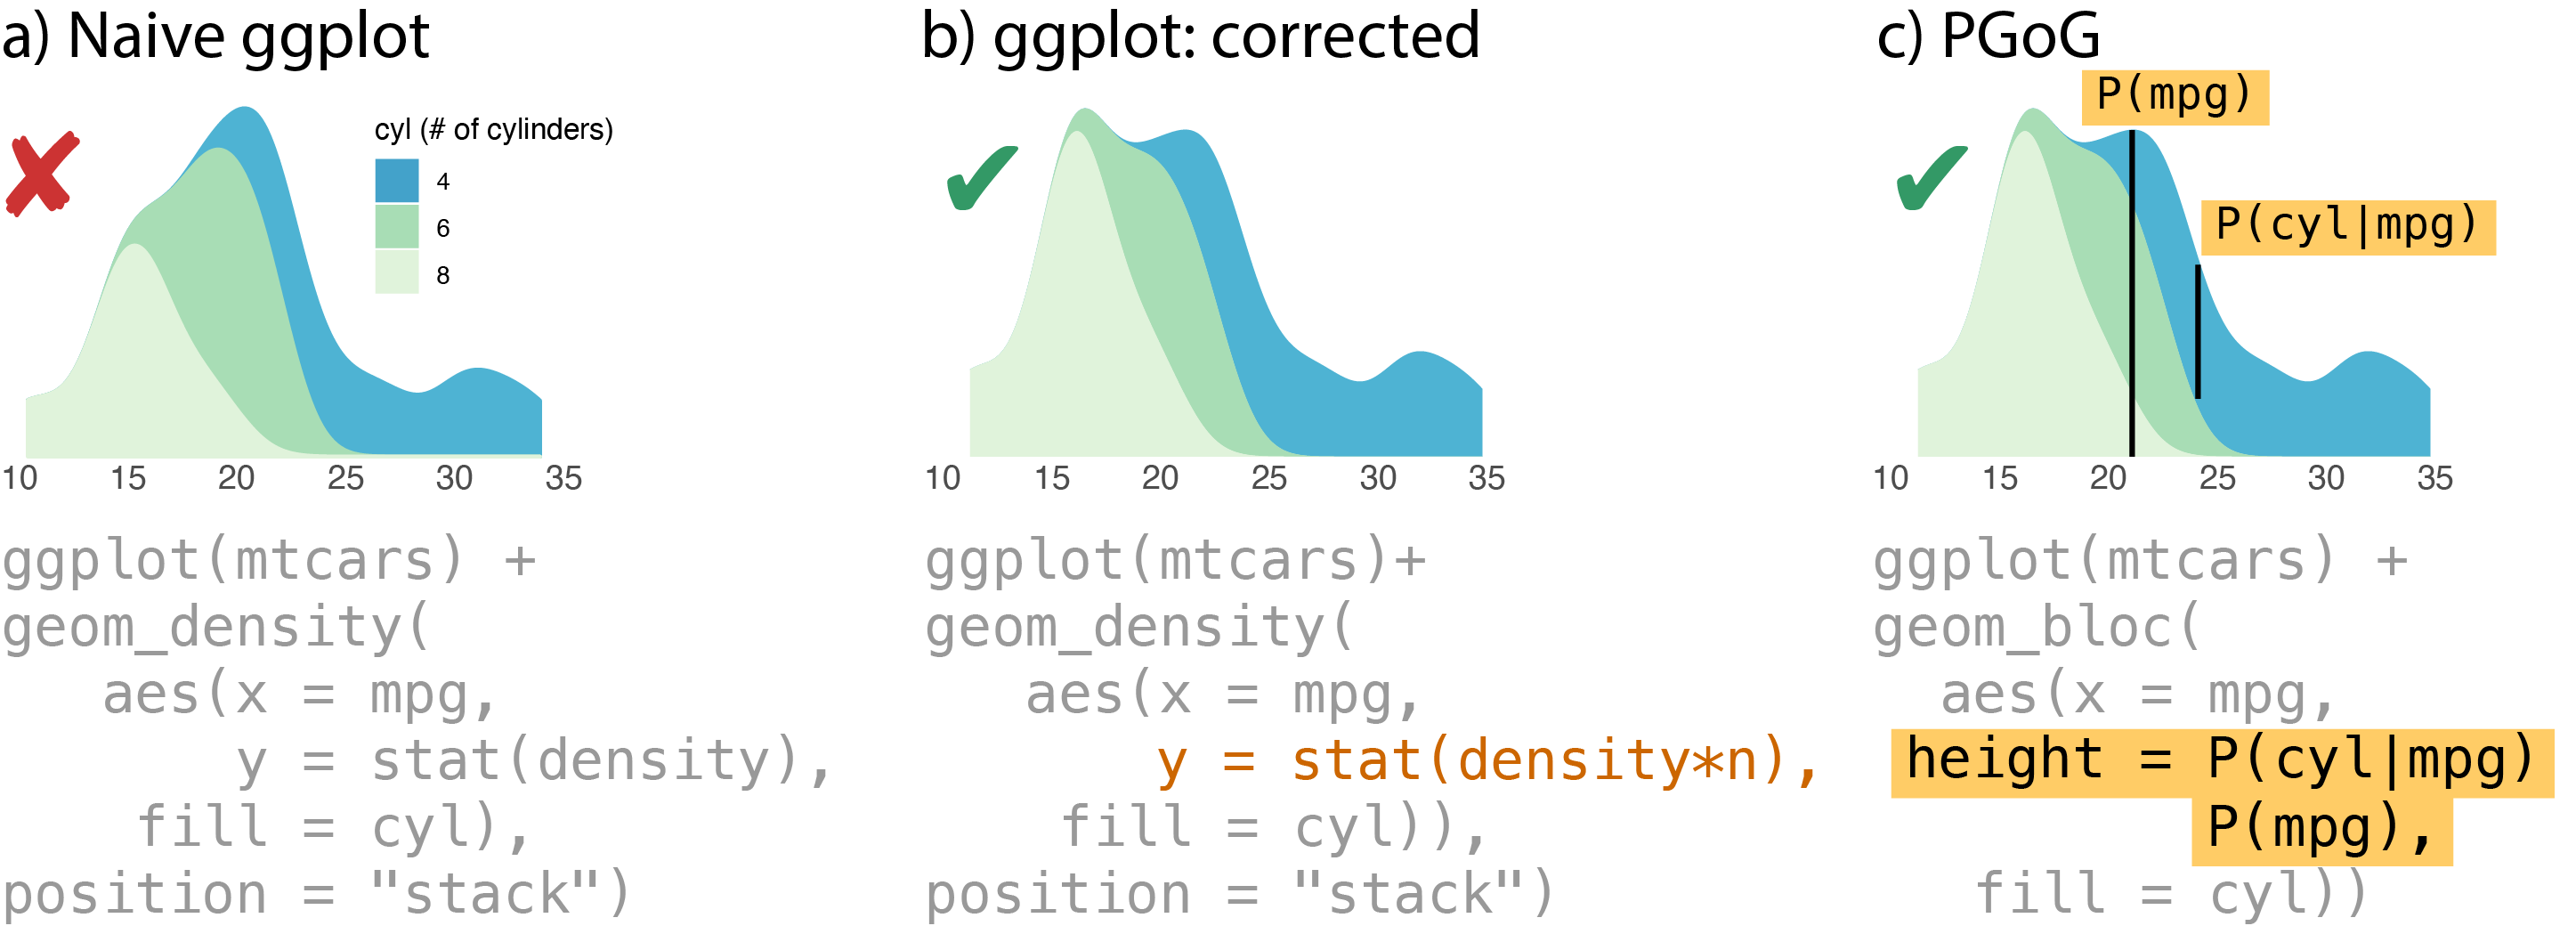
A motivating example for the Probabilistic Grammar of Graphics with the mtcars dataset. a) In base ggplot2, naively introducing the variable cyl creates partition of the density plot disproportional to the true cyl counts. b) In base ggplot2, normalizing the colored regions by hacking internal variables (density * n) creates a correct stacked density plot. c) PGoG generates the correct density plot using syntax closer to users’ statistical language, in terms of probability expressions.
Abstract
Visualizations depicting probabilities and uncertainty are used everywhere from medical risk communication to machine learning, yet these probabilistic visualizations are difficult to specify, prone to error, and their designs are cumbersome to explore. We propose a Probabilistic Grammar of Graphics (PGoG), an extension to Wilkinson’s original framework. Inspired by the success of probabilistic programming languages, PGoG makes probability expressions, such as P(A|B), a firstclass citizen in the language. PGoG abstractions also reflect the distinction between probability and frequency framing, a concept from the uncertainty communication literature. It is expressive, encompassing product plots, density plots, icon arrays, and dotplots, among other visualizations. Its coherent syntax ensures correctness (that the proportions of visual elements and their spatial placement reflect the underlying probability distribution) and reduces edit distance between probabilistic visualization specifications, potentially supporting more design exploration. We provide a proof-of-concept implementation of PGoG in R.