
Designing for interactive exploratory data analysis requires theories of graphical inference
Jessica Hullman and Andrew Gelman
Harvard Data Science Review, 2021
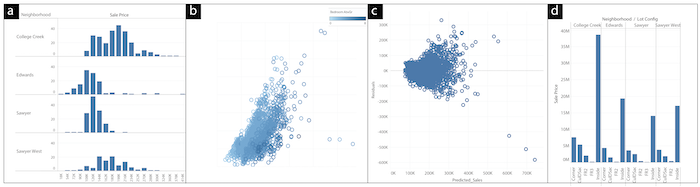
Plots of real estate data from Ames, Iowa (De Cock, 2011), created in Tableau Software (Tableau Software, 2021c). (a) Trellis plot of housing sale prices by neighborhood might invoke comparisons to a normal or log-normal distribution, and enables a visual check for a main effect of neighborhood. (b) Scatterplot of housing sale prices by square feet of above ground living area, with number of bedrooms above ground mapped to sequential color might invoke comparisons to a diagonal line representing a perfect positive correlation. (c) Residuals from multiple linear regression of sale price by above ground living area and bedrooms implied in plot b. (d) Trellis plot of sale price by lot configuration and neighborhood enables, among other effects, a visual check for an interaction between lot configuration and neighborhood.
Abstract
Research and development in computer science and statistics have produced increasingly sophisticated software interfaces for interactive and exploratory analysis, optimized for easy pattern finding and data exposure. But design philosophies that emphasize exploration over other phases of analysis risk confusing a need for flexibility with a conclusion that exploratory visual analysis is inherently “model free” and cannot be formalized. We describe how without a grounding in theories of human statistical inference, research in exploratory visual analysis can lead to contradictory interface objectives and representations of uncertainty that can discourage users from drawing valid inferences. We discuss how the concept of a model check in a Bayesian statistical framework unites exploratory and confirmatory analysis, and how this understanding relates to other proposed theories of graphical inference. Viewing interactive analysis as driven by model checks suggests new directions for software and empirical research around exploratory and visual analysis. For example, systems might enable specifying and explicitly comparing data to null and other reference distributions and better representations of uncertainty. Implications of Bayesian and other theories of graphical inference can be tested against outcomes of interactive analysis by people to drive theory development.