
A Survey of Tasks and Visualizations in Multiverse Analysis Reports
Brian D. Hall, Yang Liu, Yvonne Jansen, Pierre Dragicevic, Fanny Chevalier, Matthew Kay
Computer Graphics Forum
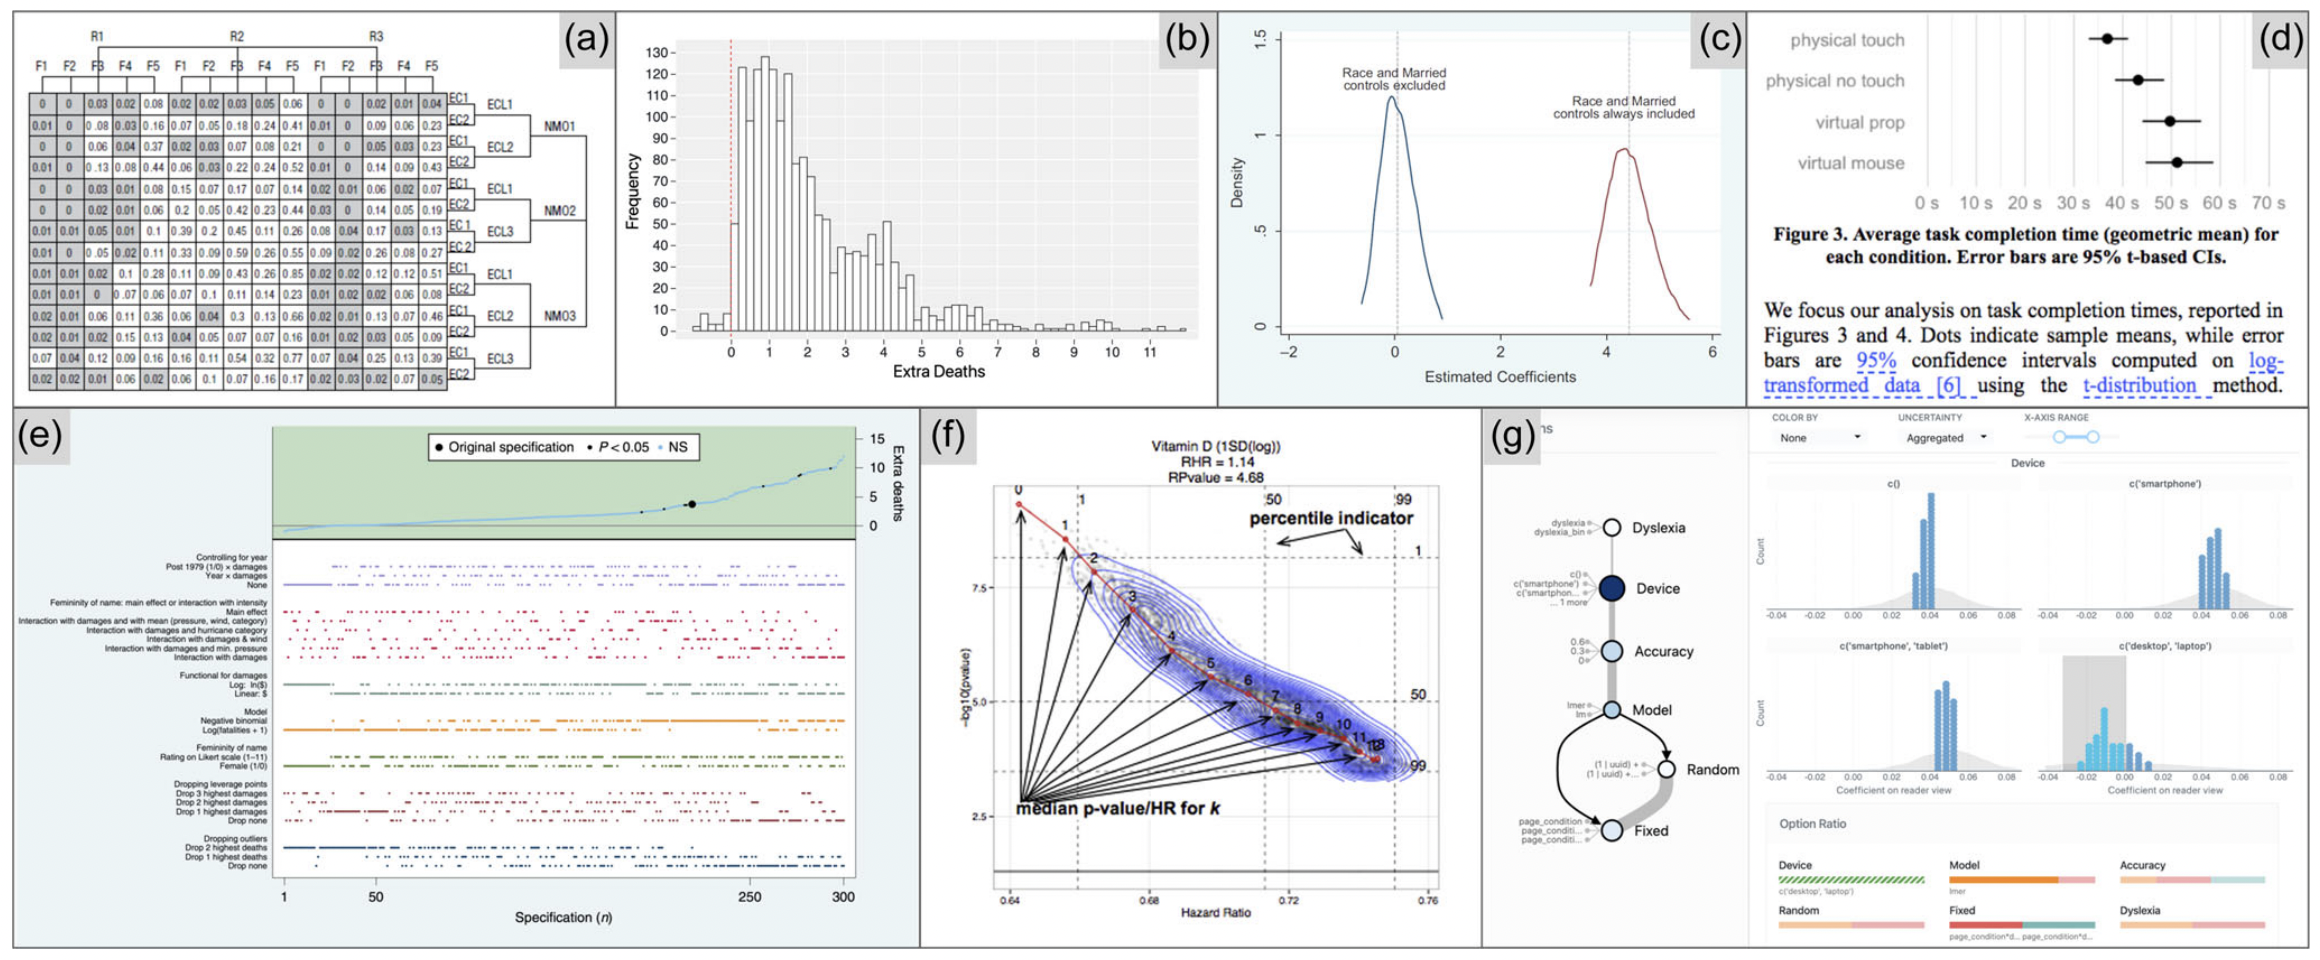
Examples of multiverse analysis visualizations discussed in this survey.
Abstract
Analysing data from experiments is a complex, multi-step process, often with multiple defensible choices available at each step. While analysts often report a single analysis without documenting how it was chosen, this can cause serious transparency and methodological issues. To make the sensitivity of analysis results to analytical choices transparent, some statisticians and methodologists advocate the use of ‘multiverse analysis’: reporting the full range of outcomes that result from all combinations of defensible analytic choices. Summarizing this combinatorial explosion of statistical results presents unique challenges; several approaches to visualizing the output of multiverse analyses have been proposed across a variety of fields (e.g. psychology, statistics, economics, neuroscience). In this article, we (1) introduce a consistent conceptual framework and terminology for multiverse analyses that can be applied across fields; (2) identify the tasks researchers try to accomplish when visualizing multiverse analyses and (3) classify multiverse visualizations into ‘archetypes’, assessing how well each archetype supports each task. Our work sets a foundation for subsequent research on developing visualization tools and techniques to support multiverse analysis and its reporting.