
Evaluating the Use of Uncertainty Visualisations for Imputations of Data Missing At Random in Scatterplots
Abhraneel Sarma, Shunan Guo, Jane Hoffswell, Ryan Rossi, Fan Du, Eunyee Koh, and Matthew Kay
IEEE Trans. Visualization & Comp. Graphics (Proc. VIS) 2022
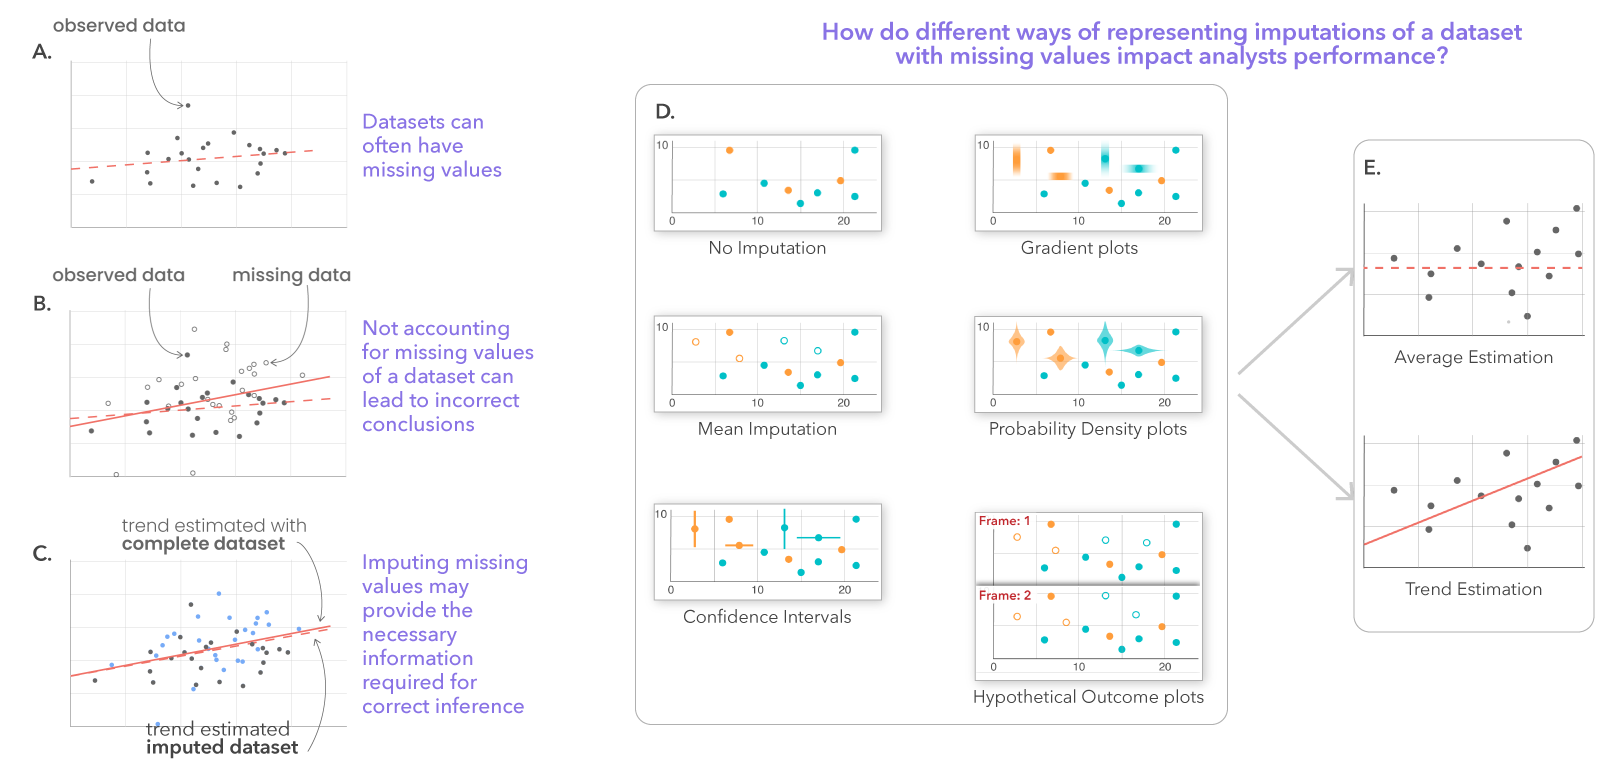
Datasets often have missing values (A). Not accounting for missing values in data can often lead to incorrect conclusions when performing common visualisation tasks such as mean or trend estimation (B). We can use various statistical methods to impute estimates for the missing values in the data, which may provide the necessary information required for correct inference (C). We use six different visual representations to present imputation and associated uncertainty information in charts (D), and measure how analysts may perform in mean or trend estimation tasks (E)
Abstract
Most real-world datasets contain missing values yet most exploratory data analysis (EDA) systems only support visualising data points with complete cases. This omission may potentially lead the user to biased analyses and insights. Imputation techniques can help estimate the value of a missing data point, but introduces additional uncertainty. In this work, we investigate the effects of visualising imputed values in charts using different ways of representing data imputations and imputation uncertainty—no imputation, mean,95% confidence intervals, probability density plots, gradient intervals, and hypothetical outcome plots. We focus on scatterplots, which is a commonly used chart type, and conduct a crowdsourced study with 202 participants. We measure users’ bias and precision in performing two tasks—estimating average and detecting trend—and their self-reported confidence in performing these tasks. Our results suggest that, when estimating averages, uncertainty representations may reduce bias but at the cost of decreasing precision.When estimating trend, only hypothetical outcome plots may lead to a small probability of reducing bias while increasing precision.Participants in every uncertainty representation were less certain about their response when compared to the baseline. The findings point towards potential trade-offs in using uncertainty encodings for datasets with a large number of missing values. This paper and the associated analysis materials are available at: https://osf.io/q4y5r/