
CALVI: Critical Thinking Assessment for Literacy in Visualizations
Lily W. Ge, Yuan Cui, Matthew Kay
ACM Human Factors in Computing Systems (CHI) 2023 | ![]() BEST PAPER HONORABLE MENTION
BEST PAPER HONORABLE MENTION
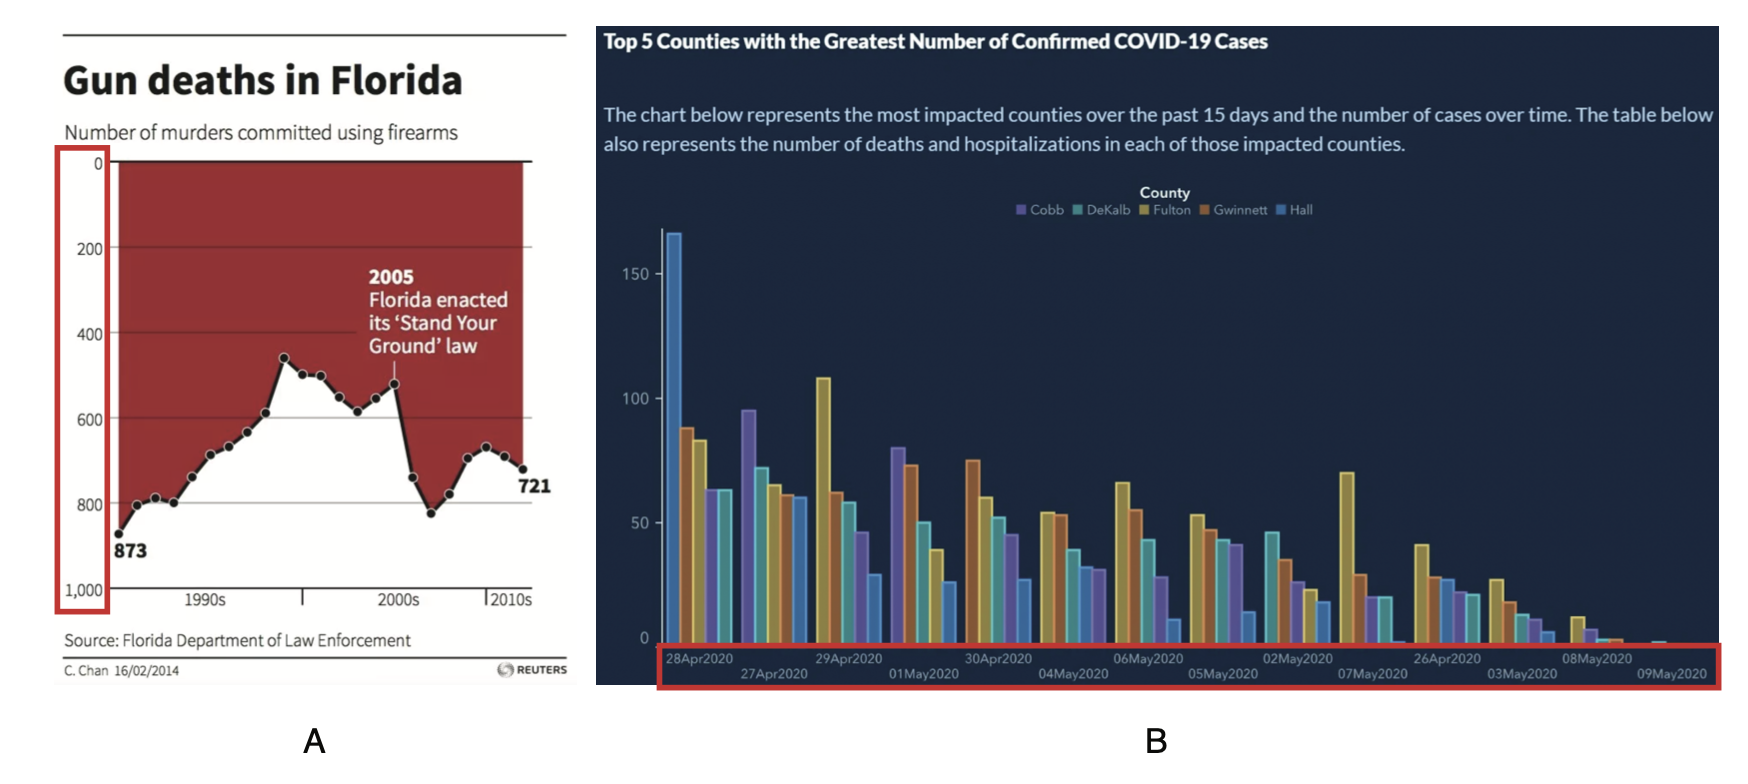
Real-world examples of visualization misinformation. The misleader in these examples is Manipulation of Scales - Unconventional Scale Directions. (A) The inverted y-axis gives a visual impression that gun deaths went down drastically after the "Stand Your Ground" law in 2005, when they actually increased [28]. (B) From a COVID-19 chart published by the Georgia Department of Public Health, the shuffled dates on the x-axis due to sorting the bars from highest to lowest seem to suggest that confirmed cases are going down [31]
Abstract
Visualization misinformation is a prevalent problem, and combating it requires understanding people’s ability to read, interpret, and reason about erroneous or potentially misleading visualizations, which lacks a reliable measurement: existing visualization literacy tests focus on well-formed visualizations. We systematically develop an assessment for this ability by: (1) developing a precise definition of misleaders (decisions made in the construction of visualizations that can lead to conclusions not supported by the data), (2) constructing initial test items using a design space of misleaders and chart types, (3) trying out the provisional test on 497 participants, and (4) analyzing the test tryout results and refining the items using Item Response Theory, qualitative analysis, a wrong-due-to-misleader score, and the content validity index. Our final bank of 45 items shows high reliability, and we provide item bank usage recommendations for future tests and different use cases. Related materials are available at: https://osf.io/pv67z/.