
GraphScape: A Model for Automated Reasoning about Visualization Similarity and Sequencing
Younghoon Kim, Kanit Wongsuphasawat, Jessica Hullman, Jeffrey Heer
CHI 2017 | ![]() BEST PAPER HONORABLE MENTION
BEST PAPER HONORABLE MENTION
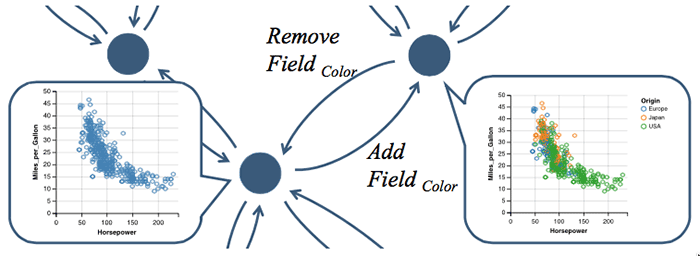
A GraphScape model. Nodes represent Vega-Lite chart specifications, edges represent edit modifications between charts. Edge weights encode estimated transition costs between charts.
Abstract
We present GraphScape, a directed graph model of the visualization design space that supports automated reasoning about visualization similarity and sequencing. Graph nodes represent grammar-based chart specifications and edges represent edits that transform one chart to another. We weight edges with an estimated cost of the difficulty of interpreting a target visualization given a source visualization. We contribute (1) a method for deriving transition costs via a partial ordering of edit operations and the solution of a resulting linear program, and (2) a global weighting term that rewards consistency across transition subsequences. In a controlled experiment, subjects rated visualization sequences covering a taxonomy of common transition types. In all but one case, GraphScape’s highest-ranked suggestion aligns with subjects’ top-rated sequences. Finally, we demonstrate applications of GraphScape to automatically sequence visualization presentations, elaborate transition paths between visualizations, and recommend design alternatives (e.g., to improve scalability while minimizing design changes).