NewsViews: An Automated Pipeline for Creating Custom Geovisualizations for News
Tong Gao, Jessica Hullman, Eytan Adar, Brent Hecht, Nicholas Diakopoulos
ACM CHI 2014

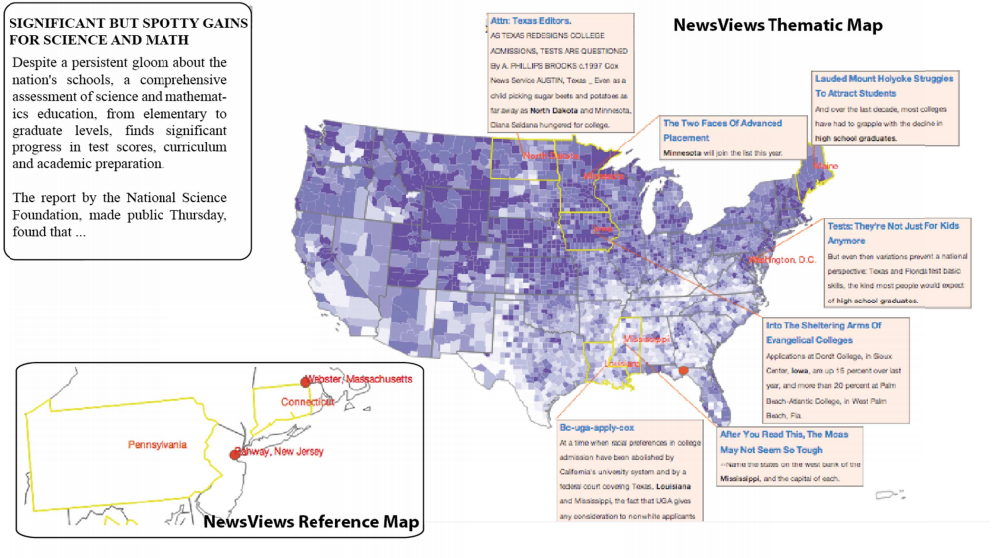
The NewsViews interface, depicting an input article and custom annotated thematic data. An example of a reference map is shown to the left.
Abstract
Interactive visualizations add rich, data-based context to online news articles. Geographic maps are currently the most prevalent form of these visualizations. Unfortunately, designers capable of producing high-quality, customized geovisualizations are scarce. We present NewsViews, a novel automated news visualization system that generates interactive, annotated maps without requiring professional designers. NewsViews' maps support trend identification and data comparisons relevant to a given news article. The NewsViews system leverages text mining to identify key concepts and locations discussed in articles (as well as potential annotations), an extensive repository of "found" databases, and techniques adapted from cartography to identify and create visually "interesting" thematic maps. In this work, we develop and evaluate key criteria in automatic, annotated, map generation and experimentally validate the key features for successful representations (e.g., relevance to context, variable selection, "interestingness" of representation and annotation quality).
