
ggdist: Visualizations of Distributions and Uncertainty in the Grammar of Graphics
Matthew Kay
IEEE Trans. Visualization & Comp. Graphics (Proc. VIS) 2023
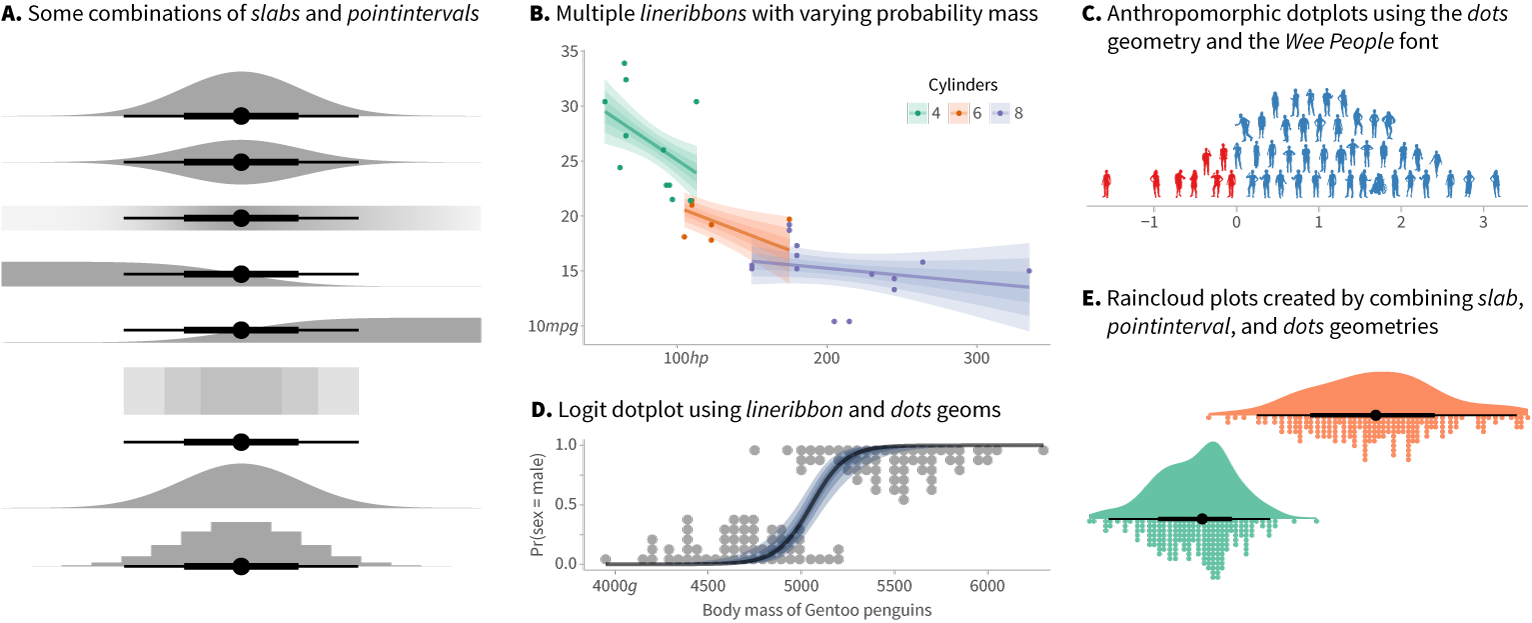
Examples from the three major classes of geometries in ggdist: (A) slabintervals, such as density plots, CDFs, intervals, and gradient plots; (B) lineribbons, such as uncertainty bands and fan charts; and (C) dots, such as dotplots and beeswarm charts. Myriad combinations of these are possible, leading to charts like (D) logit dotplots and (E) raincloud plots [1].
Abstract
The grammar of graphics is ubiquitous, providing the foundation for a variety of popular visualization tools and toolkits. Yet support for uncertainty visualization in the grammar graphics—beyond simple variations of error bars, uncertainty bands, and density plots—remains rudimentary. Research in uncertainty visualization has developed a rich variety of improved uncertainty visualizations, most of which are difficult to create in existing grammar of graphics implementations. ggdist, an extension to the popular ggplot2 grammar of graphics toolkit, is an attempt to rectify this situation. ggdist unifies a variety of uncertainty visualization types through the lens of distributional visualization, allowing functions of distributions to be mapped to directly to visual channels (aesthetics), making it straightforward to express a variety of (sometimes weird!) uncertainty visualization types. This distributional lens also offers a way to unify Bayesian and frequentist uncertainty visualization by formalizing the latter with the help of confidence distributions. In this paper, I offer a description of this uncertainty visualization paradigm and lessons learned from its development and adoption: ggdist has existed in some form for about six years (originally as part of the tidybayes R package for post-processing Bayesian models), and it has evolved substantially over that time, with several rewrites and API re-organizations as it changed in response to user feedback and expanded to cover increasing varieties of uncertainty visualization types. Ultimately, given the huge expressive power of the grammar of graphics and the popularity of tools built on it, I hope a catalog of my experience with ggdist will provide a catalyst for further improvements to formalizations and implementations of uncertainty visualization in grammar of graphics ecosystems.
A free copy of this paper is available at https://osf.io/2gsz6. All supplemental materials are available at https://github.com/mjskay/ggdist-paper and are archived on Zenodo at doi:10.5281/zenodo.7770984.