
How Data Analysts Use a Visualization Grammar in Practice
Xiaoying Pu, Matthew Kay
ACM Human Factors in Computing Systems (CHI) 2023
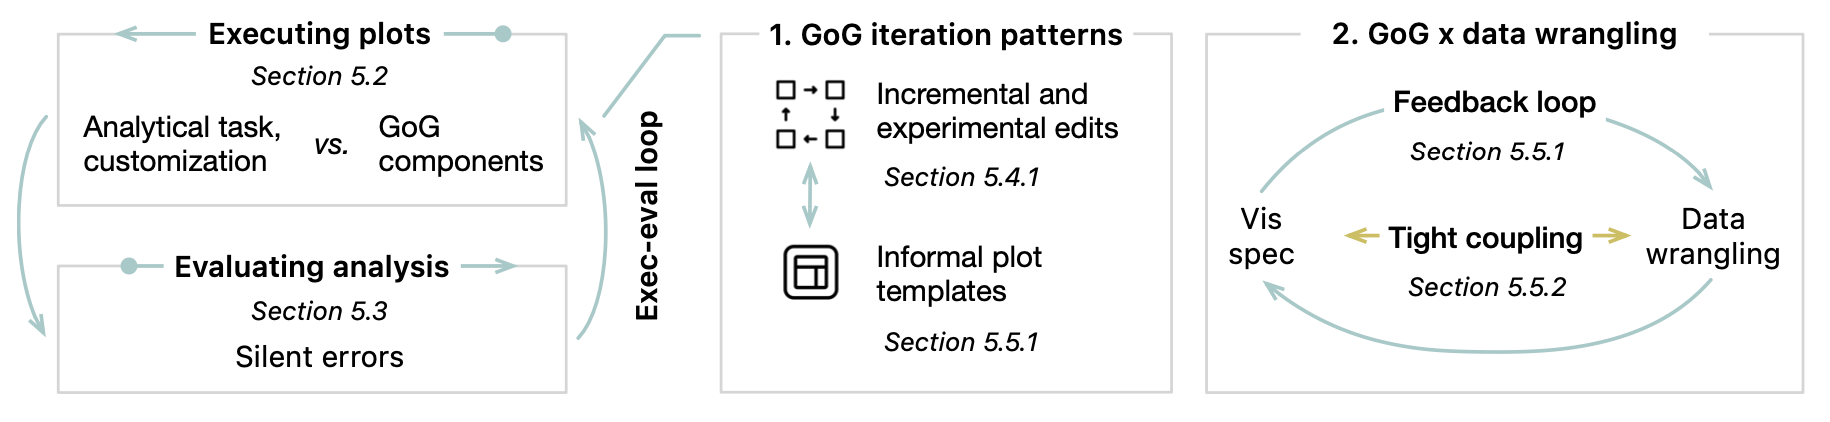
Overview of our study results on how analysts used the Grammar of Graphics (GoG)-based ggplot2.
Abstract
Visualization grammars, often based on the Grammar of Graphics (GoG), have much potential for augmenting data analysis in a programming environment. However, we do not know how analysts conceptualize grammar abstractions, or how a visualization grammar works with data analysis in practice. Therefore, we qualitatively analyzed how experienced analysts (N=6) from TidyTuesday, a social data project, wrangled and visualized data using GoG-based ggplot2 without given tasks in R Markdown. Though participants' analysis and customization needs could mismatch with GoG component design, their analysis processes aligned with the goal of GoG to expedite visualization iteration. We also found a feedback loop and tight coupling between visualization and data transformation code, explaining both participants' productivity and their errors. From these results, we discuss how future visualization grammars can become more practical for analysts and how visualization grammar and analysis tools can better integrate within a programming (i.e., computational notebook) environment.