VMC: A Grammar for Visualizing Statistical Model Checks
Ziyang Guo, Alex Kale, Matthew Kay, Jessica Hullman
IEEE Trans. Visualization & Comp. Graphics (Proc. VIS) 2024

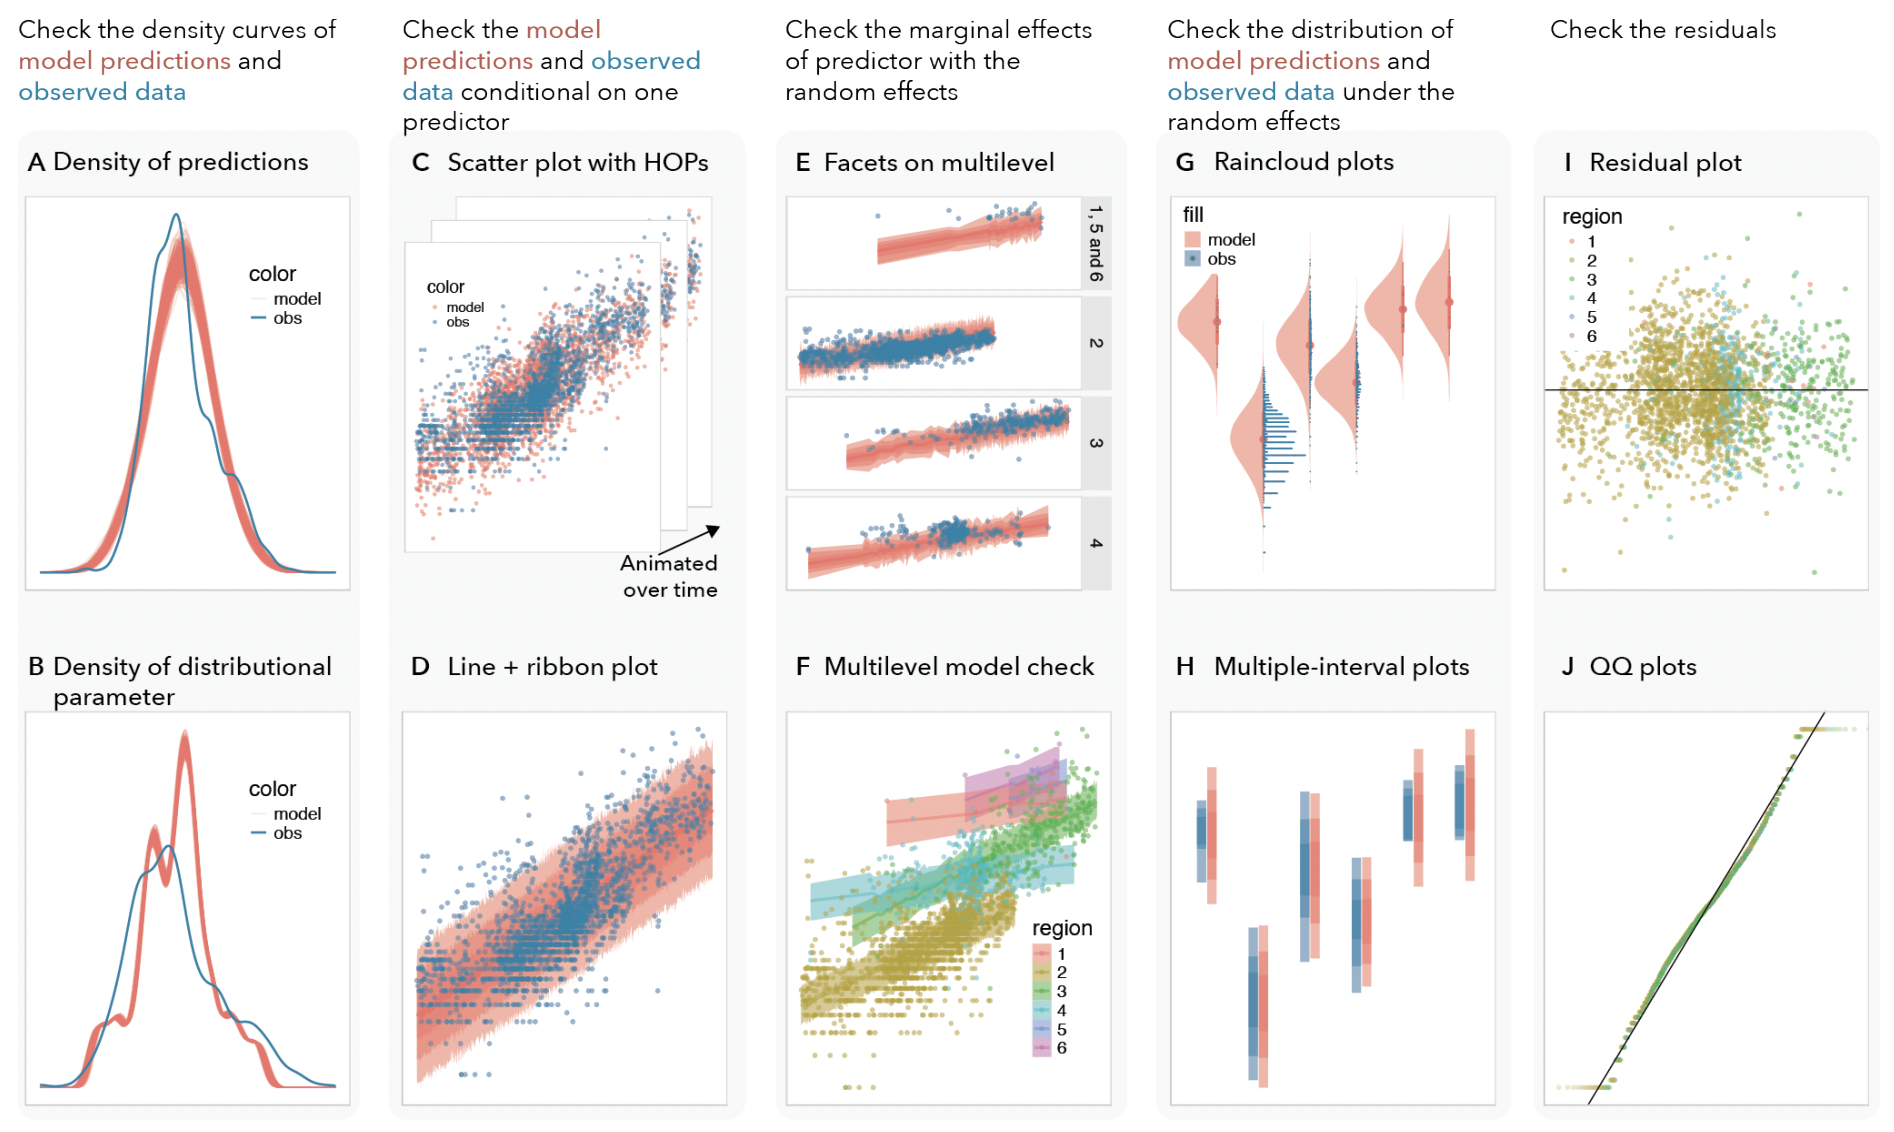
Example model check visualizations authored with VMC, using data from [46]. From left to right: checks on the density curves of the distributions of model predictions and observed data from (A) response variable to (B) distributional parameter; follow-up checks conditional on the quantitative predictor, where VMC is used to specify (C) Hypothetical Outcome Plots and (D) a line + ribbon plot; (E) a facet check stratifying the random effects and (F) a multilevel check; more checks for the random effects specified by VMC, including (G) raincloud plots and (H) multiple-interval plots; and residual checks specified by VMC, including (I) residual plots revealing the heteroskedasticity of the model and (J) Q-Q plots, validating the normality of residuals.
Abstract
Visualizations play a critical role in validating and improving statistical models. However, the design space of model check visualizations is not well understood, making it difficult for authors to explore and specify effective graphical model checks. VMC defines a model check visualization using four components: (1) samples of distributions of checkable quantities generated from the model, including predictive distributions for new data and distributions of model parameters; (2) transformations on observed data to facilitate comparison; (3) visual representations of distributions; and (4) layouts to facilitate comparing model samples and observed data. We contribute an implementation of VMC as an R package. We validate VMC by reproducing a set of canonical model check examples, and show how using VMC to generate model checks reduces the edit distance between visualizations relative to existing visualization toolkits. The findings of an interview study with three expert modelers who used VMC highlight challenges and opportunities for encouraging exploration of correct, effective model check visualizations.
PDF | Package | Documentation
