
Evaluating Visualization Sets: Trade-offs Between Local Effectiveness and Global Consistency
Zening Qu, Jessica Hullman
BELIV 2016
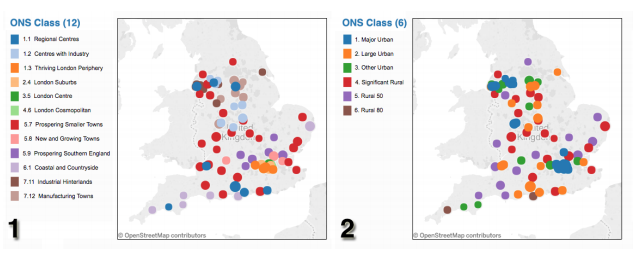
Two maps show different UK healthcare group locations. The same colors represent different data in the two views, requiring viewers to maintain several meanings for each color value in memory as they analyze the set.
Abstract
Evaluation criteria like expressiveness and effectiveness favor optimal use of space and visual encoding channels in a single visualization. However, individually optimized views may be inconsistent with one another when presented as a set in recommender systems and narrative visualizations. For example, two visualizations might use very similar color palettes for different data fields, or they might render the same field but in different scales. These inconsistencies in visualization sets can cause interpretation errors and increase the cognitive load on viewers trying to analyze a set of visualizations. We propose two high-level principles for evaluating visualization set consistency: (1) the same fields should be presented in the same way, (2) different fields should be presented differently. These two principles are operationalized as a set of constraints for common visual encoding channels (x, y, color, size, and shape) to enable automated visualization set evaluation. To balance global (visualization set) consistency and local (single visualization) effectiveness, trade-offs in space and visual encodings have to be made. We devise an effectiveness preservation score to guide the selection of which conflicts to surface and potentially revise for sets of quantitative and ordinal encodings and a palette resource allocation mechanism for nominal encodings.